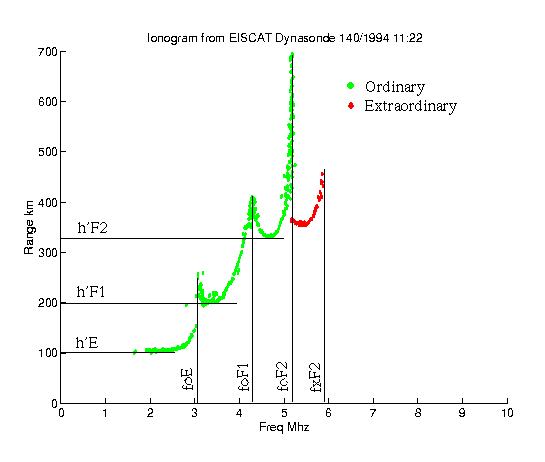
The ionogram

An ionogram is a graph of time-of-flight against transmitted frequency.
Each ionospheric layer shows up as an approximately smooth curve,
separated from each other by an asymptote at the critical frequency of
that layer. The upwardly curving sections at the beginning of
each layer are due to the transmitted wave being slowed by, but not
reflected from, underlying ionisation which has a plasma frequency close
to, but not equaling the transmitted frequency. The critical frequency
of each layer is scaled from the asymptote, and the virtual height of
each layer is scaled from the lowest point on each curve.
An ionogram can be much more complicated than just two layers.
There can also be such phenomenon as;
- The F1 layer. An additional layer which appears in the F region,
between the two existing peaks. To tell the two Flayers apart, the
upper layer is referred to as the F2 layer, and the lower layer the
F1 layer.
- Sporadic E, Es. This layer is a patchy, very dense layer sometimes
exceeding 16 Mhz (3.1 x 10^11 /m^3). Despite their intensity, these
layers do not extend over a large height range, and so do not exhibit
an asymptote at the critical frequency, as the transition is too sudden.
They appear on an ionogram as a narrow horizontal line at around 100km.
An intense Es layer can prevent any echoes from reaching the upper layers
This is known as blanketing.
- Multiple hops The return signal can skip from the Earth
to the ionosphere and back again, sometimes several times before it
is attenuated. These multiple echoes appear on an ionogram at
multiples of the original virtual height.
- D-region Absorption. This is caused by ionisation in the D-region
that absorbs the transmitted wave before it can return to the ground.
This absorption is characterised by no echoes being received from the
low frequency end of an ionogram.
- Lacuna. When turbulence occurs (as the result of large electric
fields for example), the stratified nature of the ionosphere gives way
to a more complex structure. Under such conditions, the reflected
signal may not reach the receivers, and so the height range at which the
turbulence occurs is lost on the ionosonde trace. Such gaps are termed
Lacuna and their position on an ionogram gives some indication
as to the height at which the turbulence is occurring.
- Spread-F. With an ionosonde, echos are received from any portion
of the ionosphere where the electron density gradient is perpendicular
to the transmitted wave. This most often happens overhead, but occasionally
conditions exist such that echoes from other regions of the sky return to
the ionosonde. If the electron concentration in these regions differs
from the ionosphere overhead, two traces are observed. For a given angle
from the zenith, the horizontal separation is greatest in the F-region,
and so differences in ionospheric conditions are most likely to be
observed in the F-region. If the geometry is right for echoes to be
received from a whole range of locations and the ionospheric conditions
vary over that range (such as when a trough is overhead) multiple traces
will appear on an ionogram, and the F trace is said to be 'spread'.
With a digital ionosonde, such as the Dynasonde, these traces can be
resolved by considering the horizontal position of each echo.
Ionosondes |
WDC
26-JUL-1996 Chris Davis
